Community Attributes
Basic demographic information on Dalton and Whitfield County is provided below. Additional information can be generated by contacting the Joint Development Authority. Available reports include demographics, household, income, retail spending and mosaic reports, all of which can be generated by radii and drivetime from a specific address.


Population Estimates
| Community | 2009 | 2010 | 2011 | 2012 | 2013 | 2014 | 2015 | 2017 |
|---|---|---|---|---|---|---|---|---|
| City of Dalton | 33,327 | 33,128 | 33,313 | 33,406 | 33,414 | 33,529 | 33,853 | 34,077 |
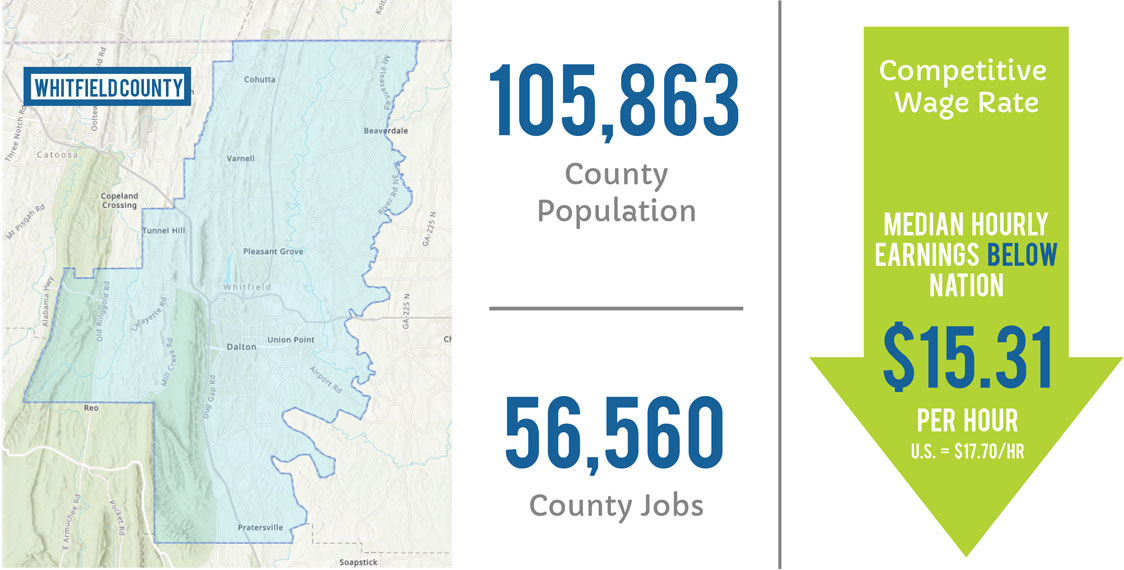
| Whitfield County | 93,698 | 102,599 | 103,184 | 103,094 | 102,945 | 103,542 | 104,216 | 105,863 |
| Dalton MSA* | 134,319 | 135,070 | 142,741 | 142,465 | 142,212 | 142,917 | 143,781 | 143,904 |
*Dalton MSA includes Whitfield & Murray Counties
Source: U.S. Census Bureau, American Community Survey


Whitfield County Demographics
| Category | 2008 | 2009 | 2010 | 2014 | 2015 | 2017 |
|---|---|---|---|---|---|---|
| Total Number of Households | 31,679 | 30,559 | 35,180 | 34,450 | 36,429 | 35,863 |
| Persons 16 or older in the labor force | 45,540 | 43,986 | 43,878 | 44,869 | -- | -- |
| Median family income (in dollars) | 43,620 | 41,375 | 48,501 | 39,946 | 40,596 | 42,583 |
| Mean family income (in dollars) | 58,345 | 55,893 | 58,103 | -- | 57,271 | -- |
| Per capita income (in dollars) | 30,355 | 27,573 | 28,588 | 30,520 | 20,353 | 20,576 |
Source: U.S. Census Bureau, American Community Survey


Race - 2017 Estimates
| County | White | African American | American Indian or Alaska Native | Asian/Hawaiian/ Pacific Islander | Other |
|---|---|---|---|---|---|
| Whitfield | 73.7% | 4.3% | 2.2% | 1.6% | 3.0% |
Ethnicity - 2017 Estimates
| Zip Code | Hispanic or Latino | Not Hispanic or Latino |
|---|---|---|
| Whitfield | 35.0% | 59.4% |
Age - 2017 Estimates
| County | Median Age | 0-14 Years | 15-24 Years | 25-34 Years | 35-44 Years | 45-54 Years | 55-64 Years | 65+ Years |
|---|---|---|---|---|---|---|---|---|
| Whitfield | 35.1 | 22.3% | 13.4% | 14.2% | 12.9% | 12.8% | 11.3% | 13.2% |

ADD ITEM TO REPORT
As you navigate our website, you can use the “Add Item to Report” button to add any page or property to a custom report that you can print out or save.

