2026 Project Purpose Celebrates Signing Day with 24 Graduates
Jun. 23, 2026
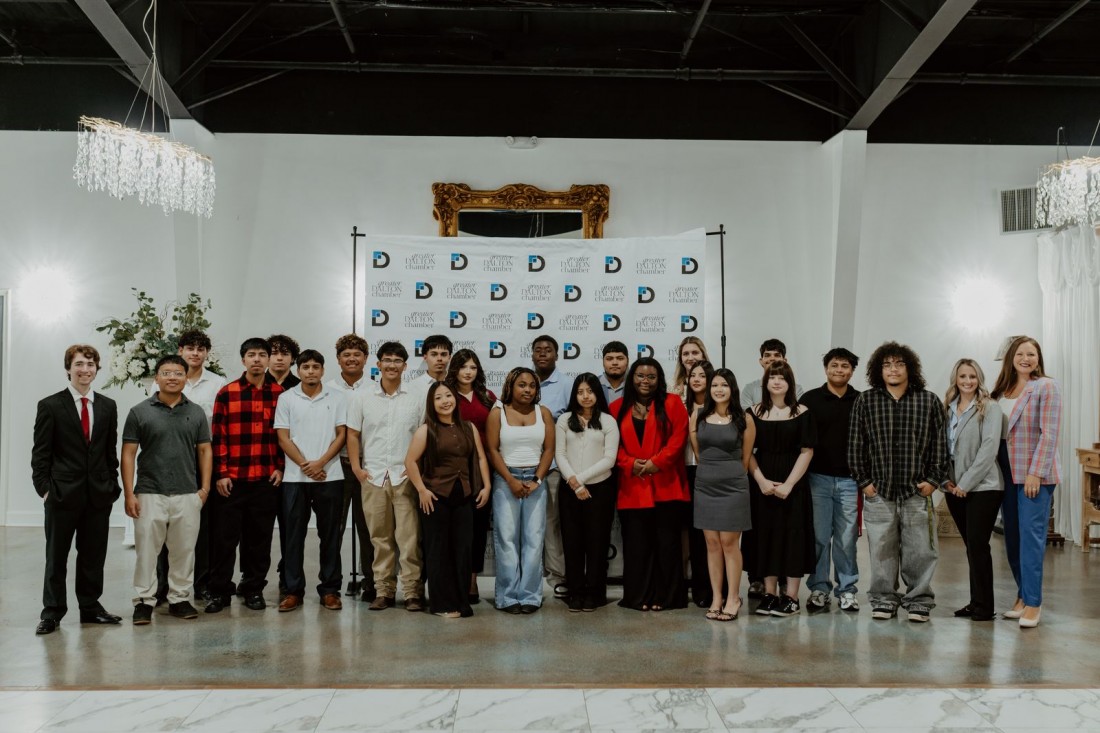
Dalton, Georgia, June 23, 2026 - On Friday, June 12th, the Greater Dalton community celebrated 23 students as they signed onto full-time jobs only a few short weeks after their high school graduations. This accomplishment was made possible through the Project Purpose program, a two-week workforce training initiative designed to prepare students who are not immediately pursuing post-secondary education for full-time careers.
The program, facilitated by Dr. Stephani Womack of the Greater Dalton Chamber of Commerce and Ali Harp of the Dalton-Whitfield Joint Development Authority (JDA), took place from June 1st to 11th, wrapping up with a signing day ceremony the following day. This program is designed for graduating seniors who are preparing to enter the workforce or are still exploring their next steps after high school. Students are connected directly with local employers and introduced to high-paying career opportunities available in Northwest Georgia.
By the end of the program, each student has been able to interview with multiple potential employers before narrowing down their job offers and accepting a position with their preferred company.
To make it to interview day, students must participate in sessions focused on professionalism, communication, workplace expectations, resume building, interview preparation, safety, quality control, financial awareness, civic engagement, and career decision-making. New to the program this year, they attended sessions on self-discovery and empowerment, mental health, and HR challenges. Students also toured local companies, met with hiring employers, and learned firsthand about the skills and expectations needed to succeed in today’s workforce.
“Project Purpose demonstrates what can happen when education, business, and community come together with a shared vision,” shared Dr. Stephani Womack, COO and Chief Talent Officer for the Greater Dalton Chamber. “Every student deserves to see a future filled with opportunity. We are incredibly proud of these students and grateful to the employers and community partners who believe in their potential and help make this year’s success possible.”
For many participants, Project Purpose serves as a bridge between graduation and full-time employment, helping them begin their careers with stronger confidence, better preparation, and a clearer understanding of their options. Students were able to choose from a variety of local employers to pursue careers with: Dalton Utilities, Engineered Floors, Essentia Protein Solutions, Hamilton Medical Center (Vitruvian Health), Mohawk Industries, Qcells, Shaw Industries, and MFG Chemical.
A key component of Project Purpose is helping students understand that meaningful careers are available close to home. Through employer-led sessions and facility tours, participants were able to explore industries such as advanced manufacturing, chemical, utilities, healthcare, logistics, and other high-demand sectors that continue to drive the regional economy.
“This program is about helping students connect the dots between where they are today and what their future could look like here in Greater Dalton,” said Ali Harp, Project Manager for the JDA. “They get to see inside local companies, meet employers, build confidence, and discover career pathways they may not have known existed. That is powerful for students, and it is powerful for our workforce.”
24 students in total completed this year’s program, 23 of whom signed contracts for full-time, high-paying jobs, with the remaining student deciding to pursue another opportunity. All students were recognized at the signing day celebration.
The success of Project Purpose is made possible through the support of local employers, schools, speakers, volunteers, and community partners who invest their time and resources into preparing the next generation of the workforce. The program is backed by Program Sponsors, Dalton Utilities, Engineered Floors, Qcells, and Shaw Industries.
As the 2026 graduates take their next steps, Project Purpose continues to demonstrate the power of connecting education, industry, and community around one shared goal: helping young people find purpose, opportunity, and a strong career path close to home.
Congratulations to the Project Purpose Class of 2026.
ADD TO REPORT
As you navigate our website, you can use the “Add Item to Report” button to add any page or property to a custom report that you can print out or save.